Helping Citizens Understand Budget Allocations for their Neighborhood
About the Project
Data-driven factsheets to assess budget allocations in a city
Client / Collaborators
Janaagraha
How we helped
Bulk Report Production, Design Automation, Infographics, Chart Generation
Helping Citizens Understand Budget Allocations for their Neighborhood
About the Project
Data-driven factsheets to assess budget allocations in a city
Client / Collaborators
Janaagraha
How we helped
Bulk Report Production, Design Automation, Infographics, Chart Generation
Helping Citizens Understand Budget Allocations for their Neighborhood
About the Project
Data-driven factsheets to assess budget allocations in a city
Client / Collaborators
Janaagraha
How we helped
Bulk Report Production, Design Automation, Infographics, Chart Generation
THE BRIEF
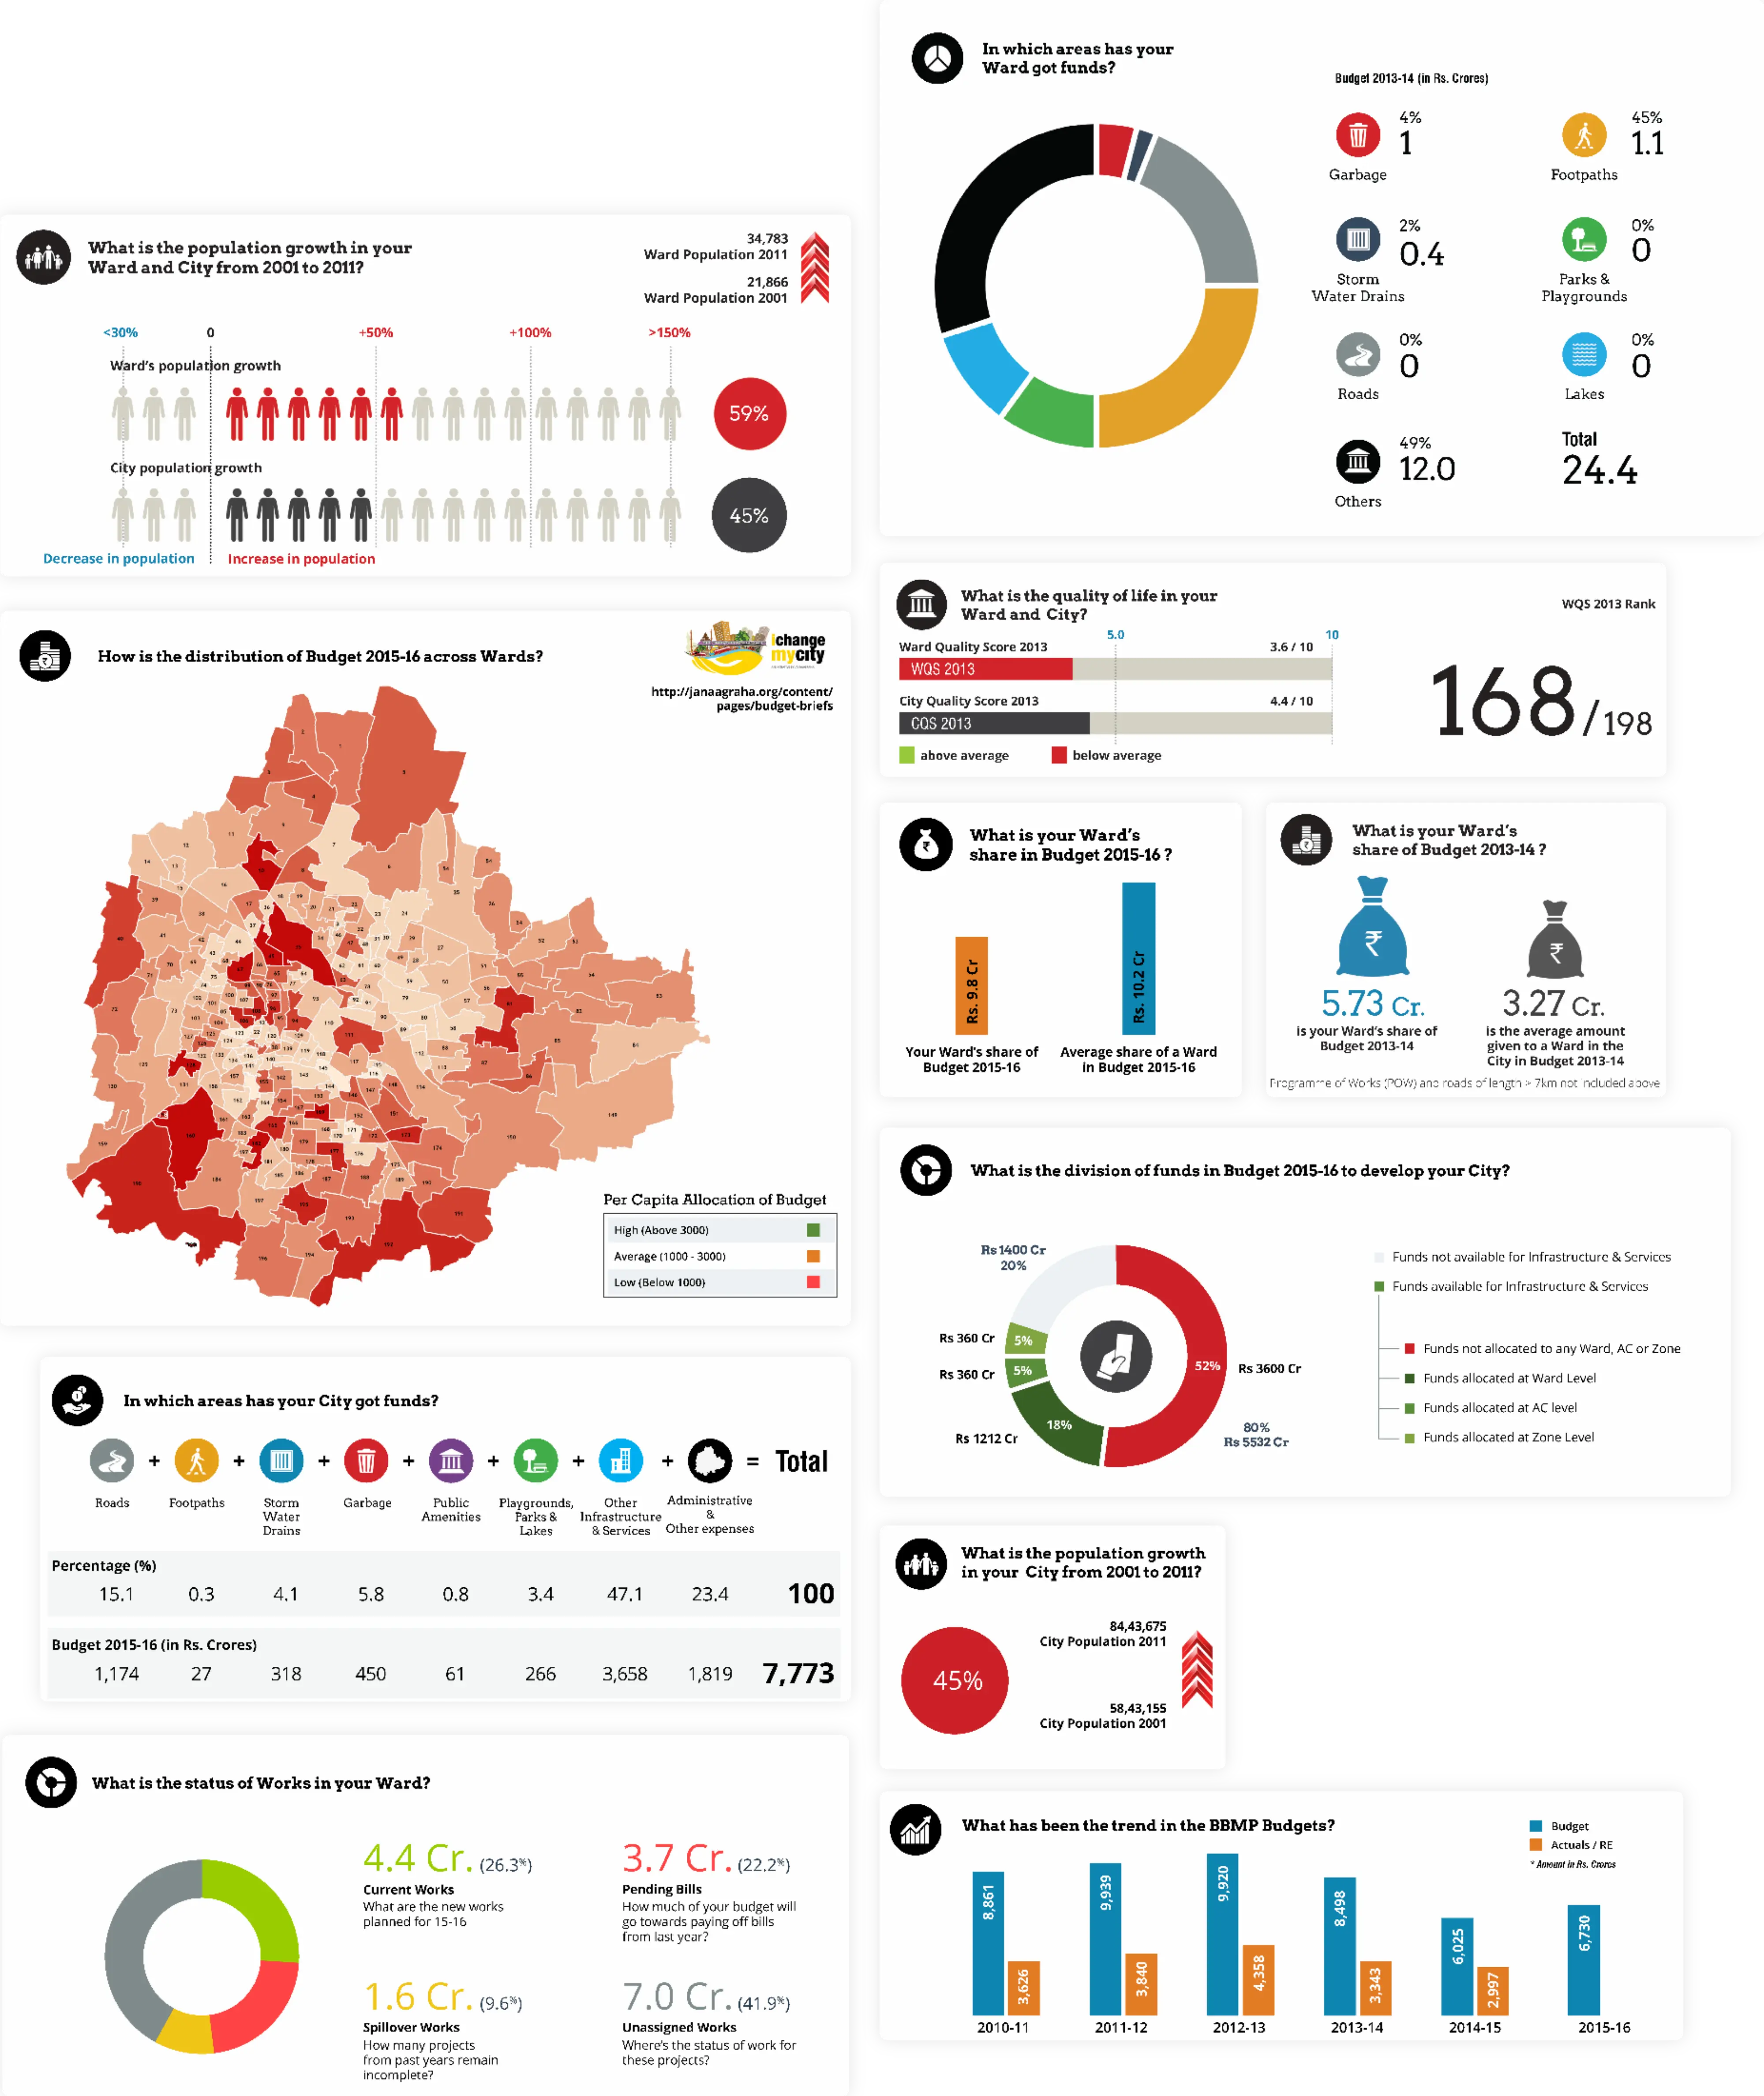
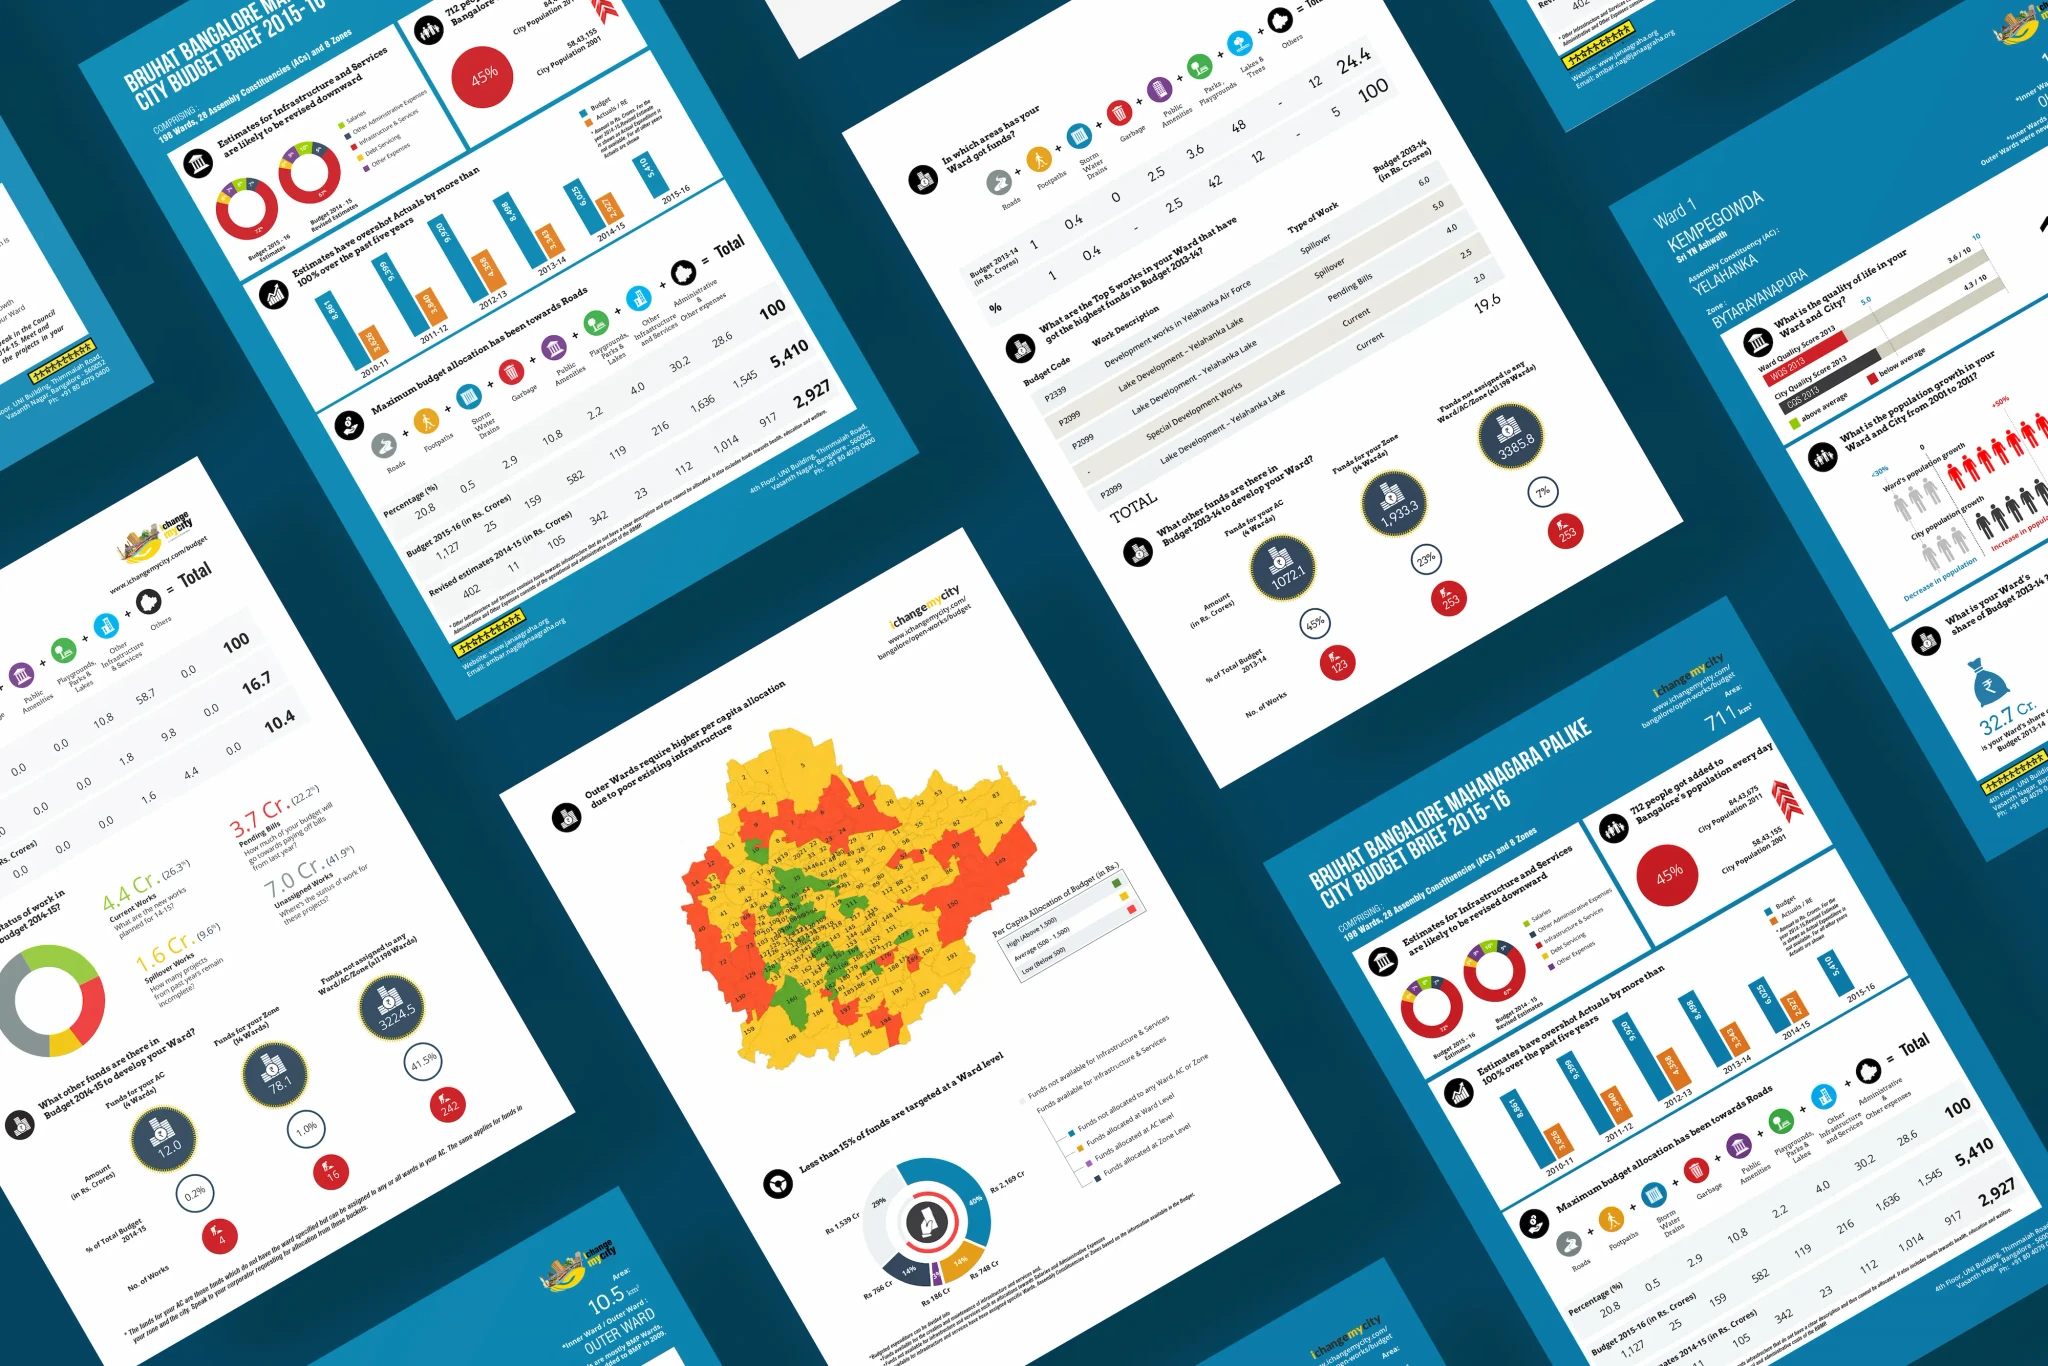
Produce more than 1500 factsheets across 40,000 data points using a variety of charts using a single spreadsheet.
DATA SOURCE
40,000
Data Points
THE OUTCOME
1500
Factsheets